Council Rate & Insurance: Pay Monthly, Quarterly or Annually?

I’ve got the latest Auckland Council rate bill earlier this month and the council rate went up again. As an Auckland rate payer, you will have a choice to either payment annually or quarterly. If you choose to pay annually, you will have a massive discount of… 0.83% on your bill.


1487817201033.jpg

Thanks, Phil

It got me thinking: how should other rate payers and I decide if we should pay annually with that discount or quarterly without a discount? Will that discount big enough to offset my lost interest? What sort of return on investment do I need if I plan to pay quarterly?

Not a Simple Math

I was discussing this problem with a friend and he said, “it’s really easy to work out, just take the discount you’ve got from the council and compared that to your bank interest rate. If your interest rate is higher, keep your money at your bank.” I know there are some people using this method as their back-of-the-envelope calculation. However, it’s a bit more complicated than that. We will need to fire up excel to analysis this.

source.gif

Prerequisite

Before we jump into the analysis, we need to check on two things:

  1. Will you benefit from the service for the next full year?
  2. Do you have to cash to do either option (pay annually and quarterly)?

If you answer no to either question, you should pay quarterly. There is no point to pay for something you know you are not going to use or enjoy. In the context of Council rate bill, I am planning to own this house for the next year, so I’ll benefit from this payment. I also have to cash to do both as I’ve been expecting this bill.

Two Choices: Annually and Quarterly

The difference between pay annually and quarterly is how are they are going to affect our cash position and the interest gain from that cash. If we pay annually up front, we will take a hit on cash but rewarded with a small amount of surplus cash from the discount. That cash can sit in the high-interest account to earn interest. On the other hand, if we pay quarterly, we will have more cash to earn interest at the beginning.

Here is the assumption in our analysis:

Cash on Hand: $2,500
Quarterly Payment Amount: $625/Quarter
Annual Payment Amount: $2,479.25
Discount on Annual Payment: 0.83%
Serious Saver Interest Rate: 2.2% (not change during the year)
Resident withholding tax rate: 33%

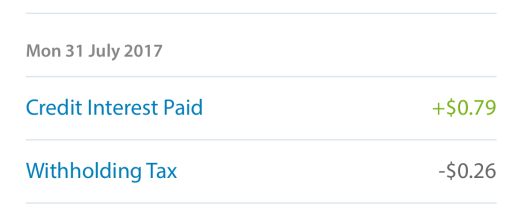
The quarterly payment is $625/quarter, so the total cash included in this analysis will be $625 x 4 = $2500. I used BNZ rapid save account as our serious saving account here. (By the way, BNZ Rapid Save is one of the better serious saver accounts out there.) The interest rate is at 2.2% and its allow one withdraw per month without losing the bonus interest.

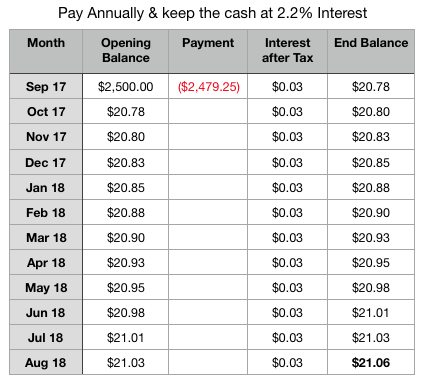
Pay Annually: If we pay annually up front, we will have $20.75 in cash after discount. We will keep those cash in a serious saver account for a year and the amount of the end of the year will be $21.06.

Screen Shot 2017-08-28 at 1.04.32 PM.png

Pay Quarterly: We will start with $2,500 cash and pay out $625 every 3 months. All cash will keep in a serious saver account. The interest generates more interest in the beginning as the cash level was higher. Towards the end of the year, the remaining cash amount at $13.96.

Screen Shot 2017-08-28 at 1.04.38 PM.png

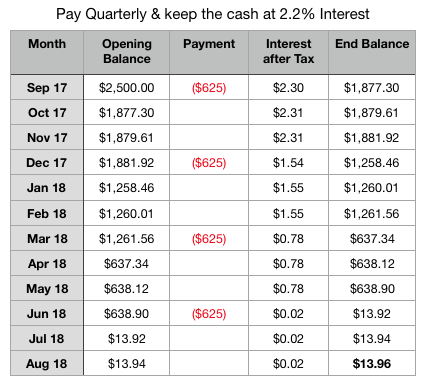
Therefore, if you keep the cash in a serious saver account with 2.2% interest, you will be better off to take the annual payment discount.

Breakeven Point

If we keep increasing the interest rate (or expected rate of return), pay quarterly will eventually yield better return for your money. The reason is when we pay quarterly, the cash we kept in the beginning of the year is able to generate enough interest to offset the discount from paying annually. Check out the chart below.

Screen Shot 2017-08-28 at 2.34.15 PM.png
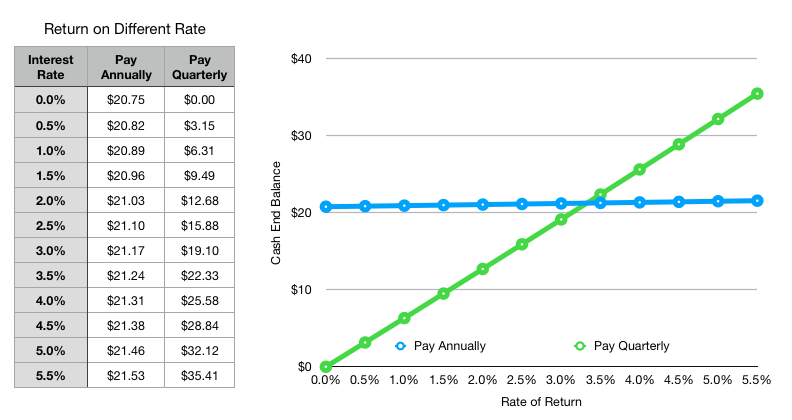
After some boring math (get equation on both lines then apply quadratic formula), the breakeven point is at 3.33%. Therefore, in the context of Auckland Council rate bill with 0.83% up he front discount, you should pay quarterly if you can get over 3.33% pre-tax return (2.23% after-tax or tax-free) on your cash. Any rate below 3.33%, you should just pay annually and take the discount.

When you Should Pay Quarterly?

You may think it is not hard to get an investment return over 3.3% given you can get a similar return on term deposit (3% – 4.2%), or index fund around 6%. However, the time frame is only 1 year, and you will have to withdraw part of them out every 3 months. So index fund is out of the window because expected return in a single year can be between 25% to -25%. A term deposit is not an option as well as you can’t take part of the money out every 3 months.

The better choice I can think of is Offset Mortgage on Home Loan. You keep more cash in your account to offset mortgage interest fits all criteria. The return is tax-free and guaranteed at around 5.75% plus you can access your cash every 3 months. To do that, you’ll have an existing home loan and had set up with offset mortgage or revolving credit.

Other good options include:

  • Pay off consumer debt – very high return, but you will have existing consumer debt in the first place
  • Top up KiwiSaver for member tax credit – very high return, not available if you are full time employed
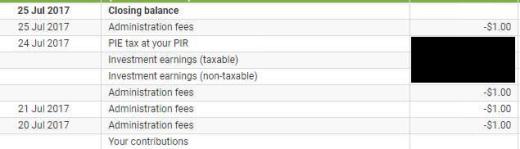
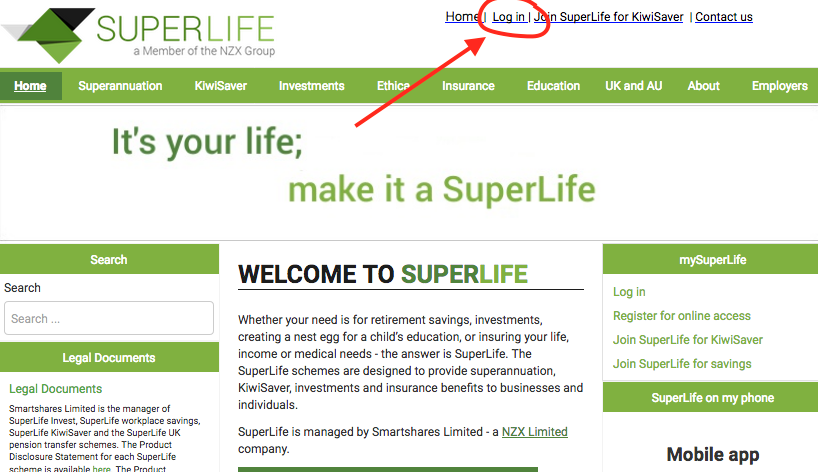
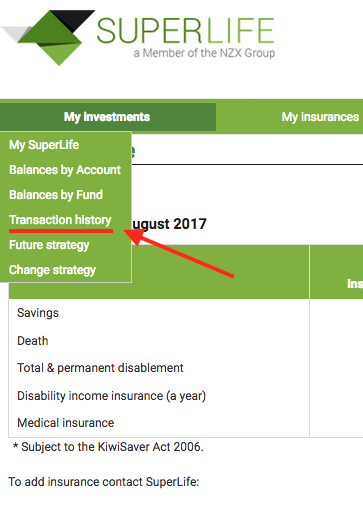
  • SuperLife NZ Cash Fund – better than bank return, 7 years after tax and fees return at 2.62%, can easily get your money out, not recommended if you are not existing SuperLife investor

In my opinion, if you don’t have offset mortgage and consumer debt, just pay it off up front. It’s easier, and you don’t have to deal with the bill every 3 months.

Insurance: Annual vs Monthly Payment

The same analysis can apply to insurance payment. Most Car, house, and contents insurance will provide different payment options. Check out the example below for a car insurance quote.

Screen Shot 2017-08-28 at 3.18.39 PM.png

The discount from insurance company are much better at (42.6 x 12 – 469.32)/(42.6 x 12) = 8.19%. If we apply the same analysis, here is the result.

Screen Shot 2017-08-28 at 3.34.43 PM.png

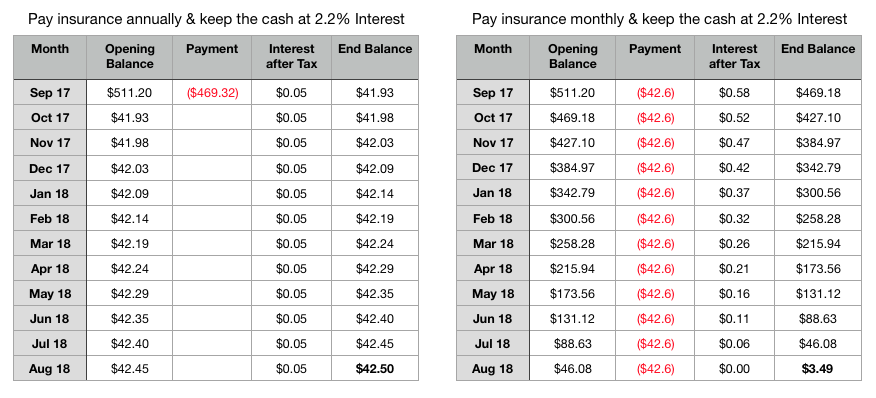
Pay up front have a superior return on your cash and the breakeven point is at 28.5%. I don’t think there is any investment options other than paying off a high-interest loan can top that. Therefore, if you have the cash and you will benefit from the insurance for a full year, you should pay annually on your insurance.

Here is a simple graph that shows the break even return rate on different payment discount.Screen Shot 2017-08-28 at 10.07.09 PM.png

You simply look at the annual payment discount and refer to the break even return rate to decide if you should take the annual payment discount. For example, you’ve got a 7% discount if you pay your house insurance annually compare to monthly. According to the graph, if you have an investment with 24% pre-tax return (like use that money to pay off the credit card), you should pay monthly.

Conclusion

  • Pay quarterly if you don’t have the cash or not going to benefit from the service for a full year.
  • With Auckland Council rate, pay annually if the 1-year return on your cash is below 3.33%.
  • If you have existing consumer debt or offset mortgage facility, pay quarterly on council rate and use the cash to pay off or offset your loan.
  • Insurance usually offer a great annual payment discount so try to pay annually if you can.

Email thesmartandlazy@gmail.com or follow me on Twitter @thesmartandlazy if you have any questions.

Different Tax on SmartShares and SuperLife ETF

Recently a tax accountant contacted me regarding my post on comparing cost on ETF investing between SmartShares and Superlife. He pointed out that apart from the admin fee and management cost, investors also need to consider the tax implication when investing. I’ve known about this issue but did not include on my blog because I did not fully understand the rules. After I’ve asked around and done some research, here is my finding on different tax treatment on SmartShares and Superlife ETF and why does it matter to New Zealand investor.

Disclaimer: I am NOT a tax accountant or expert. In fact, I am pretty bad at tax despite I’ve done a couple tax papers at university. So what I am going to say would be incorrect. If you notice anything wrong in my blog post, please let me know and I will correct that ASAP. You should contact a tax accountant or IRD for tax advice.

What are PIE and PIR?

According to IRD website,  a portfolio investment entity (PIE) is a type of entity, such as a managed fund that invests the contributions from investors in different types of investments. Eligible entities that elect to become a PIE will generally pay tax on investment income based on the prescribed investor rate (PIR) of their investors, rather than at the entity’s tax rate.

Prescribed investor rate (PIR) is the tax rate that PIE fund use to calculate the tax on the income it derives from investing your contributions. It based on your taxable income, e.g. income from salary, wages and any additional sources of income (including the income from your investment) that you would include on your income tax return.

For an individual, your PIR can be 10.5%, 17.5% and 28%. Check out IRD web site to work out your PIR rate.

How PIE Works?

I will explain PIE with ‘interest on saving account’ as an example. You usually received interest by saving money in a bank account. If you look closely at that interest transaction, you can see the bank gave you some interest, then IRD take away some as ‘Withholding tax’. Check out the transaction below.

IMG_7875

So I earned $0.79 in interest, but IRD took $0.26 away.  The amount decided how much IRD can take is based on my Resident withholding tax (RWT). In this situation, the RWT is 0.26/0.79 = 33%. You can work out your RWT here.

For people who are having a full-time job, their RWT rate will likely to be 30% or 33%. That’s where PIE come in. The most common PIE fund you will see is the PIE account at your Bank. There are ANZ PIE Fund, Term PIE at BNZ, PIE Funds at Kiwibank and Westpac Online Saver PIE.

If you put money in those PIE accounts, in stead of paying 30% or 33% on your interest earned, you will be paying the max PIR rate at 28%. So in my situation, IRD will only tax $0.22 on my $0.79 interest income. The amount may seem tiny here, but if you have $20,000 saved in a PIE Term deposit with 3.5% interest, you will just have to pay $196 on tax instead of $231.

Different PIEs with SmartShares and SuperLife ETF

There are different types of PIEs and we will talk about Multi-Rate PIE and Listed PIEs here.

Multi-rate PIE (MRP) is a type of PIE that uses the investors’ prescribed investor rates (PIRs) to calculate the tax on the investment income it earns from the investors’ contributions. Most PIEs are multi-rate PIE including SuperLife and Simplicity fund.

A listed PIE is a type of PIE listed on a recognised exchange in New Zealand, and they calculate the tax on a fixed rate regardless of investors PIR. SmartShares ETFs are listed PIE, and they will pay tax at 28%. Check out section 6 on SmartShares’ product disclosure statement.

So the main difference between those two investments are you will pay 28% tax on SmartShares ETF and with SuperLife ETF Fund, you will pay tax according to your PIR.

Why Does it Matter to Investor

An investor needs to work out their PIR so they can decide each provider is more tax efficient. You don’t want to overpay your tax. There are three different PIRs for individuals: 10.5%, 17.5% and 28%.

For people who earn over $48,000 a year for the past 2 years, their PIR will likely to be at 28%. In this case, there is no tax different between SmartShares and SuperLife ETF as you will pay 28% on taxable income with both funds.

For people who are on low or no income, their PIR could be at 10.5% or 17.5%. They can be students, children, part-time/casual worker, stay-home mum/dad and retirees. In this case, they will pay tax on their PIR with SuperLife ETF Fund while SmartShares will still charge 28% tax on them. Therefore, they will pay extra tax with SmartShares.

Here is an example on US 500 ETF valued at $20,000. We will compare the value after tax and fee with the different tax rate. Assume there was no contribution and no value change during the year. Taxable income calculated at 5% of the portfolio under FIF rule. Ignored Smartshares $30 setup fee.

Screen Shot 2017-08-23 at 11.28.09 AM.png

Despite SmartShares have a lower management cost and no annual admin fee, investors with 10.5% or 17.5% PIR will end up better with SuperLife as they paid less tax. That’s more reason for you to choose SuperLife ETF Fund if you are on low PIR rate.

Conclusion

  • If your PIR is at 28%, pick SmartShares or SuperLife based on cost, functions, and experience. In my opinion, SuperLife is the better choice for most ETF except US 500 ETF. You can check out my comparison here.
  • If your PIR is at 17.5% or 10.5% SuperLife ETF Fund provide a better return due to the lower tax paid. The amount of tax saved will increase the value of your portfolio.
  • Investor at lower PIR can get the excess tax back with a tax return.
  • Since most of the investment funds are multi-rate PIE. It is essential you work out the correct PIR and submit that to your fund manager. You can work out your PIR here.
  • Consult IRD or a tax accountant for tax advice.

Email thesmartandlazy@gmail.com or follow me on Twitter @thesmartandlazy if you have any questions.

InvestNow Added SmartShares ETFs into their Offerings

InvestNow announced they added 7 SmartShares ETFs into their investment platform. They are the following:

Screen Shot 2017-08-18 at 9.52.26 PM.png

You can access to those ETFs from SmartShares, Superlife, and Sharesies (on some ETF) already. I’ve compared the cost on those ETFs on the previous post and concluded you should get most of the ETF from Superlife except US 500; SmartShares was the better choice for US 500. You can check out the related post below

Related post: Compare ETF Fund Cost between Superlife and Smartshares

Cheapest Option for US 500 ETF

Smartshare was the cheapest option for investing in US 500 ETF because of the low management fee at 0.35% and no annual admin fee. There is a $30 set up fee if you use SmartShares contribution plan and at least $30 exit fee when you sell your ETF.
If you buy or sell the ETF on the share market, there will be $30+ transaction fee on each transaction. Superlife US 500 ETF fund has a higher management fee at 0.49% and charges a $12 annual fee. Sharesies have the same management fee with SmartShare, but they charge $30/year on admin fee. Therefore SmartShares contribution the cheapest option for US500 ETF investing.

Now InvestNow added SmartShares ETF into their offerings, it further lower the cost of US500 ETF. InvestNow offers an investment platform for investors with no annual admin fee. Investors can also bypass the $30 set up fee and the cost of exit the fund on SmartShares ETF. The minimum investment amount lower at $250 and no contribution commitment required. The management fee will be the same with SmartShares at 0.35%. Check out the comparison below. (Update: InvestNow client can now set up regular investment with just $50/transaction.)


Different Way of Contribution

By looking at the number, InvestNow investors can save on $30 set up and the $30+ cost of exit, so it appears to be a better deal to SmartShares. There is a difference on how you contribute to the fund between Smartshares and InvestNow. Take a look at the function difference below.

Screen Shot 2017-08-17 at 10.19.29 PM.png

The main limitation for InvestNow investors is the lack of small amount direct debit. SmartShares Investor will be committed to at least $50/month contribution (can be stopped at request). InvestNow investors are free to contribute whenever they want. However, the minimum contribution amount will be $250/transaction. If you only have $50/month to invest, you will have to put money in InvestNow once every five months to reach the $250 requirements. So on the one hand, you will save $30 in the beginning, but you will miss five months possible loss/return. (Update: InvestNow client can now set up regular investment with just $50/transaction.)

Compare Return Between InvestNow and SmartShares

(Update: InvestNow customer can now set up regular investment plan with just $50/transcation. InvestNow will be a better choice over SmartShares in terms of cost.)

To work out which one is the better deal on US 500, I ran an analysis to compare the return between InvestNow and SmartShares.

I assume the investor has $500 available to invest and can contribute $50/month. With SmartShares, the fund going to start with $470 due the to $30 setup fee and the investor will contribute $50/month. At InvestNow, investor’s fund will start with $500 and will contribute $250 every five months. The investor will continue for five years (60 months) without any withdrawal. Expected return rate is 10.32% before tax. Here is the breakdown.

Screen Shot 2017-08-17 at 10.54.15 PM.png

Although SmarShares charge a $30 setup fee up front which lowered the starting amount to $470, they ended up with a higher end balance at $4,640.51. The reason is Smartshares investor contribute $50 every month, and those funds are growing while InvestNow customer’s money is sitting in the bank doing nothing.

Here is the result of different levels of contribution at the end of the fifth year.

Screen Shot 2017-08-17 at 11.46.57 PM.png

SmartShares investor has a higher return over InvestNow at a lower rate, the gap close as they reach $250 marks. I stopped at $250/month because once you can contribute that amount, you can put money in InvestNow every month. From this point, InvestNow customer will always have better return over SmartShares

It seems SmartShares will be a better deal if your contribution under $200/month. However, there is a flaw in this analysis.

In my assumption, I set the rate of return at 10.32% for all five years. It assumpts the share price of the ETF going up in a straight line and investor will have a positive return every month. However, in real life share price goes up and down every day. By contributing less frequently, InvestNow investor may lose some of the gains during those five months, but they also avoid some drop as well. Afterall, the share price looks like this in real life.

Screen Shot 2017-08-17 at 11.19.52 PM.png

Applying Real Data

So I collected the share price of US 500 ETF for the past 24 months and plugged that into our analysis. Here is the result. Click here to see the ROI. 

Screen Shot 2017-08-17 at 11.50.36 PM.png

This time InvestNow ended up with a higher balance over SmartShares. In fact, Investnow beats SmartShares on every contribution level with past data. Check out the result below.

Screen Shot 2017-08-17 at 11.48.25 PM.png

The Real Deciding Factor

No one knows how the US 500 ETF is going to perform in the future so either service can be cheaper. If you look closely at the amount, the cost difference between InvestNow and SmartShares are insignificant, less than 0.1% of your fund. So investors will need to consider their contribution level and the experience of those two services.

In my opinion, InvestNow functions and its user interface are much better than SmartShare. InvestNow have a modern, clean and easy to understand platform. SmartShares’ holder will be checking their current stock holding on Link Market Service web site. The interface feels like it stuck in 2010.

Related post on InvestNow and SmartShares (Link Market Service)

The main limitation on InvestNow is lack direct debit option, so it’s not a “set and forget” type of investment solution. The investor will have to deposit the money into InvestNow platform and manually invest US 500 ETF on InvestNow website. InvestNow said the direct debit function is on the road map so the situation may improve in the future.

Link Market Service interface for SmartShares is not good, but you can view your holding on other services like ShareSight, Google Finance, and Yahoo Finance to improve that experience.

Conclusion

It’s great to see InvestNow adding more and more fund onto their platform. I prefer InvestNow interface and function over SmartShares. However, I understand everyone circumstances are different so here are some recommendations which service you should consider on US 500 ETF.

  • Use SmartShares if you want a ‘Set and Forget’ solution and you plan to contribution between $50 – $200/month. (Update: InvestNow customer can now set up regular investment plan with just $50/transcation. InvestNow will be a better choice over SmartShares in terms of cost.)
  • Use InvestNow if you like their user interface (you can register for free on InvestNow to check out the interface), don’t want to commit to a monthly contribution plan and happy to invest manually at minimum $250.
  • Use SuperLife if you already have a portfolio with SuperLife and want to have all funds under one flexible service with great functions.
  • Use Sharesies if you like their interface. Check out my comparison here.
  • For other ETFs, you should use SuperLife, here is why.

Email thesmartandlazy@gmail.com or follow me on Twitter @thesmartandlazy if you have any questions.


How to Check Your Investment Fund and KiwiSaver Fund’s Admin Fee

A reader asked me about their Superlife fund charges. She notices something funny on her transaction list: Instead of charging $1/month on admin fee, she got charged $1/day.

YR1WBxL.jpg

After checking my transaction, I believe those charges are incorrect and she contacted Superlife. Superlife immediately said the charges were wrong and reversed them straight away.

This is a good reminder for all investors to a take look at their transaction once in a while. I am all for ‘set and forget’ method to invest but we should look at those charges maybe once or twice a year. Not only to Superlife but all of your investments including your KiwiSaver.

I have account with Superlife and KiwiSaver with Simplicity, here is how to check those transactions

Superlife

Go to superlife.co.nz and click on “Log in”

Screen Shot 2017-08-04 at 11.41.53 AM.png

Click “Transaction history” on the left

Screen Shot 2017-08-04 at 11.43.06 AM.png

Select ‘last 12 months’ on period, select ‘All’ on Funds, select ‘Administration Fees’ on Transaction types.

Screen Shot 2017-08-04 at 11.44.26 AM.png

They should charge $1/month. (The $2.75 charges was before the admin fee price drop)

Screen Shot 2017-08-04 at 11.45.50 AM.png

Simplicity KiwiSaver

Go to Simplicity.kiwi and Log in.

Screen Shot 2017-08-04 at 11.55.28 AM.png

Click ‘My transaction’ on the menu.

Screen Shot 2017-08-04 at 11.56.20 AM.png

There will be a list of transactions and Simplicity should charge $2.5/month on member fee.

Screen Shot 2017-08-04 at 11.57.03 AM.png

If you are with a different fund or service and don’t know how to check transactions, call the service provider and ask them.

If there is anything out of the ordinary, you should contact the fund manager and get them to correct that as soon as possible.

Quickly Work Out How Much You​ (Roughly) Saved

Wealth is not about how much you make, it’s how much you saved.

Most people have a pretty good idea of their income every week/fortnight/month. However, in personal finance, the important number is not the amount you made but how much you managed to save. This figure is calculated by your income minus your expenses. It sounds easy, but you will be surprised as lots of people have no idea what their expenses are. Hence they don’t know how much they saved. They may be doing alright, or they may over spend every month. Without working out those numbers, you simply don’t know.

giphy-2.gif

No worries, there is a simple way to work it out.

To work out how much you save, you will need to make a profit and loss statement on your finances, just like the financial report for the company. Yes, it may seem time-consuming and lots of hard work, especially for those people who are not good with numbers. So for those lazy Kiwis out there, here is a quick way to roughly work out your saving amount, expense and saving rate in about five minutes.

What Numbers Will You Need?

To do this lazy version of profit and loss statement, you will need three sets of numbers.

Bank Balance this month: Go and gather the balance of ALL bank account, including cheque, saving, serious saver, term deposit and credit card. You can get this number from internet banking or bank statement. For example, today is 28/7, so I need to find out the account balance of 1/7. Make sure you record the credit card balance as negative. Add them all up to get your current cash balance.

Bank Balance 12 months ago: We need another set of account balance (cheque, saving, serious saver, term deposit, and credit card) to compare the numbers. Try to get the balance from 12 months ago, so we cover the income and spending for a full year. You can get that from internet banking (search the balance history) and old bank statement. Add them all up to get your cash balance 12 months ago.

Screen Shot 2017-07-28 at 9.38.44 AM.png

Check out the example above. In July 2016, we have a $2000 term deposit, and it matured during the year. So in July 2017, the term deposit is $0. On the other hand, we opened up a new serious saver account during the year, so in July 2017 we have a second serious saver account with $2800.

Your income after tax and KiwiSaver: We will need to get the income for your last 12 months.

  • If you are employed, you can get your gross pay on your pay slip.Also, you can log on to MyIR at IRD to check your gross pay.
  • If your income hasn’t changed much during the year, you can use one income to estimate a full year income. You just need to multiply your weekly pay by 52, fortnightly pay by 26 and monthly pay by 12.
  • If you know your annual income before tax, put that number into paye.net.nz, and they will calculate your take home pay.
  • If you have another source of income outside employment, you will need to add those in as well. (Like Investment income, rental property income)
  • If you have uneven income or self-employed, you will need to sit down and review your bank transaction to work out your income.

If you can’t get the bank balance 12 months ago, you will need to adjust your income for the same period. For example, you can only get the balance 6 months ago, then you will need to calculate your income during this 6 months period.

Saving Amount

We can work out your saving amount with those two bank balances. Let’s look at our previous example.

Screen Shot 2017-07-28 at 9.38.44 AM

In July 2016, the total balance was $17,220 and in July 2017 was $20,596. During the year, the balance increased 20596 – 17220 = $3376. So our annual saving amount is $3,376, average is 3376/12 = $281.33/month.

Expenses

To work out the expenses, you will need the annual income amount with those two bank balances. The logic behind the math is very simple. You started with your Bank balance 12 months ago: During that year, you made some money, you spent some money and you ended up with the current bank balance.

To turn that statement into a formula will be :

Bank Balance 12 months ago + Income (after tax) – Expense = Currently Bank Balance

We move around that formula, we will get:

Expenses = Bank Balance 12 months ago + Income – Currently Bank Balance

Using our example with a 55K income ($43,065.5 after tax and KiwiSaver). The expense will be

17200 + 43065.5 – 20596 = $39,669.5/Year, $3,305.79/month

Saving Rate

Saving rate is the percentage of income you managed to save after expenses. The math is:

Saving Amount / Income Amount = Saving Rate

Using our example with a 55K income ($43,065.5 after tax and KiwiSaver). The saving rate will be

$3376 / 43065.5 = 7.84%

Why do it over a 12 months period?

The main reason we try to get the bank balance and income for a 12 months period is that our spendings are uneven through out the year. Most people will spend more toward the end of the year because of Christmas and new year. If you only cover 6 months from March to September, you may under estimate your spending. If you cover November to May, you may over estimate. So it best to cover a full year.

What If you buy or sell something big during the year?

For example, if you purchase a Car during the year for $10,000 and you are not the kind of people buy car every year, you should exclude that in your bank balance.

Screen Shot 2017-07-28 at 1.06.26 PM.png

On the other hand, If you sold your car for $10,000 during the year and you are not doing that every year, exclude that as well.

Basically, we are trying to work out the saving from your typical day to day income and expenses while ignoring one-time big event.

Should you exclude investment contribution?

Some people may use their savings to do some investing like KiwiSaver contribution, Index fund investing, top-up mortgage payment on rental property or pay extra on your own mortgage. If we calculate the saving with our previous formula, we will treat those transactions as expenses.

Bank Balance 12 months ago + Income (after tax) – Expense – Investment Contribution = Currently Bank Balance,

We turn it around

Expense + Investment Contribution = Bank Balance 12 months ago + Income – Currently Bank Balance

You can see investment contribution inflated the expenses amount. In my opinion, the reason we calculate the saving amount and saving rate is to work out how much money we could invest for our future. Therefore, I will include some investment contribution into all calculation.

I will categorize those investment contributions into two group, Voluntary and Involuntary. Voluntary investment is those you can stop contribution anytime if you choose, like your Superlife/SmartShares contribution, KiwiSaver top-up or you made a lump sum repayment on your home mortgage. Involuntary investment is the one you are obligated to pay, like mortgage top up on your negative cash flow rental property. You have to top up those mortgage payment every month. Otherwise, the mortgage will be in arrears.

Here is an example, during the year, you have the following amount went to investment.

Voluntary:
SmartShares Conrtibution – $1,200
P2P Lending – $500
KiwiSaver Top up – $1,043
Own home mortgage voluntary repayment – $500
Total: $3,234

Involunary:
Rental home mortgage top-up – $3,500

Here is the Saving amount after invesment exclusion on voluntary invesment.

Screen Shot 2017-08-01 at 3.11.48 PM

The adjusted saving amount will be 23839 – 17220 = $6,619/year, $551.58/month

Adjusted Saving rate will be 6619 / 43065.5 = 15.37%

The adjusted expenses will be 17200 + 43065.5 – 20596 – 3243 = $36,426.5/Year, $3,035.54/month

What’s the Limitation with this method

This lazy method will give you a rough idea on much you saved, but it comes with limitation and flaws.

  • Rough figures: The bank balance will be accurate, but your income amount may not be. It depends on how you collect and calculate your income amount. If there is any error in income, the expenses amount will be off.
  • No expenses break down: You will have a rough figure on your expense, but there is no break down on where you spent the money. You simply don’t know where you spent your money without a line by line breakdown.
  • Ignore interest income: This method ignores interest you made on your deposit. If you have $20K in the bank with 2.5% interest, it will generate about $330 after tax interest. It is not that much compared to average income, but if you have $200K in the bank, that will be $3300.
  • Ignore seasonal fluctuation: This method worked out the income and expenses throughout the year and divided by 12 to get the monthly average. However, in reality, our spending fluctuate every month. In winter, we will spend more on power and gas, we shop more during Christmas and new year and, we may travel during the summer. All those factors will affect your month-to-month expenses and saving amount. You may overspend in some months while saving a lot in others.

Without knowing your saving amount is like driving down a country road at night with headlights off, you may be driving into a hole without knowing. Hopes this straightforward and lazy method will provide a rough idea of your saving amount and shed some light on your financial situation.

If you want to get into the details of your finances, you will have to spend time and do a detail report. We will get into that in the future.

Email thesmartandlazy@gmail.com or follow me on Twitter @thesmartandlazy if you have any questions.